Thesis — five pillars
Adds ~₹1,600 Cr of high-margin India/EM branded revenue at ~18–20x EV/EBITDA — attractive vs listed BRG peers. Torrent's 1.2mn-chemist distribution, brand-building playbook and CV/GI overlap should drive revenue synergies of 6–8% on the acquired base and 150–200bps of EBITDA-margin uplift over FY27–29.
Market-leading CV/GI franchises, ~30% EBITDA margins and chronic-therapy pricing power deliver 10–12% organic growth with limited NLEM exposure.
Niche and limited-competition US portfolio protects the base; Brazil brand-led growth of ~15%+ and Heumann (Germany) OTC expansion diversify the growth algorithm.
ROE ~27%, dividend payout ~58%. Torrent generates ~₹2,500+ Cr of annual free cash flow at steady state, which we expect to restore pre-acquisition leverage within ~2 years while sustaining dividends.
Promoter-led (Torrent Group), conservative accounting, and disciplined capital allocation demonstrated across the Unichem and Curatio integrations.
Key data
| Metric | Value | Metric | Value |
|---|---|---|---|
| Market cap | ₹1,90,146 Cr | Price (27 Aug 26) | ₹4,999 |
| 52-wk range | ₹3,480 – ₹5,250 | Shares outstanding | ~380 mn |
| P/E (TTM) | ~79–85x | P/B | ~20x |
| ROE (3Y avg) | 26.2% | ROCE | 15.2% |
| Dividend yield | 0.76% | Promoter holding | ~68% |
| FII / DII | ~16% / ~13% | Face value | ₹5 |
Financial summary (₹ Cr, consolidated)
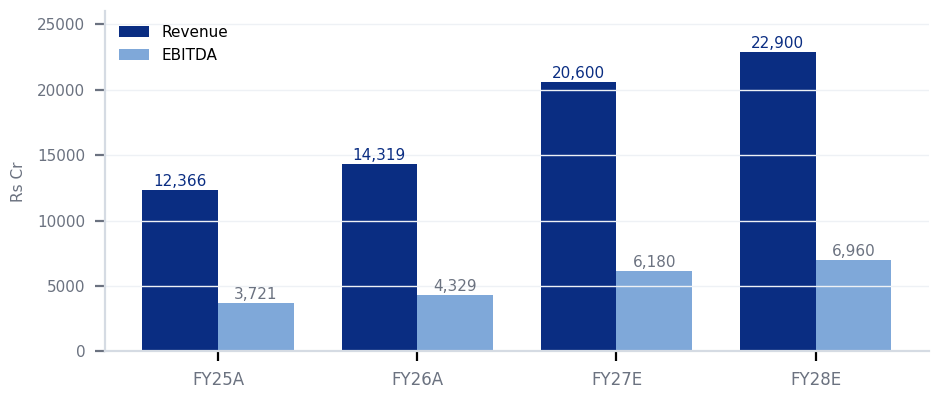
| FY25A | FY26A | FY27E | FY28E | |
|---|---|---|---|---|
| Revenue | 12,366 | 14,319 | 20,600 | 22,900 |
| growth % | 9.3% | 15.8% | 43.9% | 11.2% |
| EBITDA | 3,721 | 4,329 | 6,180 | 6,960 |
| margin % | 30.1% | 30.2% | 30.0% | 30.4% |
| PAT | 1,907 | 2,115 | 2,720 | 3,240 |
| EPS (₹) | 56.6 | 62.0 | 71.6 | 85.3 |
| P/E (x) | 88x | 81x | 70x | 59x |
| DPS (₹) | 24.0 | 27.0 | 33.0 | 41.0 |
FY26A includes JB Chemicals from Q4 FY26; FY27E assumes full-year JB. E = illustrative estimates derived from public data.
Segment & quarterly snapshot
| Business (FY26 mix) | Growth trend | Comment |
|---|---|---|
| India BRG (~38%) | +10–12% | CV/CNS/GI leadership; chronic-led; low NLEM exposure |
| US generics (~19%) | +5–8% | Niche + limited competition; stabilising base |
| Brazil & LatAm (~15%) | +14–16% | Brand-led; B2C strength; INR-BRL stable |
| Germany/Europe (~11%) | +6–8% | Heumann OTC rollout; tender business de-risked |
| JB Chemicals + EM (~17%) | acquired | Metrogyl/Rantac/Nicardia; India + CEM/SSA/SEA |
| Quarter | Revenue | EBITDA | Margin | PAT |
|---|---|---|---|---|
| Q2 FY26 (Sep-25) | 3,302 | 1,082 | 32.8% | 591 |
| Q3 FY26 (Dec-25) | 3,303 | 1,069 | 32.4% | 635 |
| Q4 FY26 (Mar-26)* | 4,197 | 1,112 | 26.5% | 389 |
| Q1 FY27 (Jun-26) | 4,921 | 1,335 | 27.1% | 566 |
₹ Cr; *JB consolidated from Q4 FY26 — elevated D&A/interest (₹~510/~240 Cr) on acquisition assets temporarily depresses PAT. Q1 FY27 revenue beat street (est. ~₹4,730 Cr).
Valuation: where could consensus be wrong?
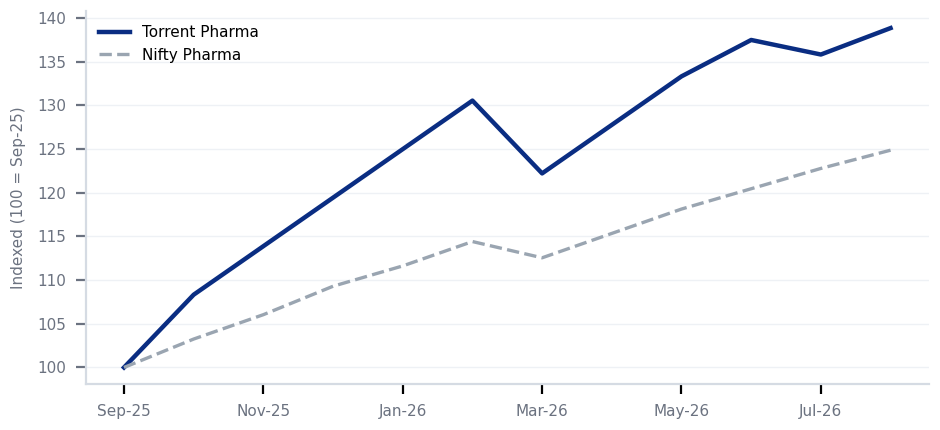
Consensus 12-month targets of ~₹4,700–4,900 are anchored on pre-deal organic estimates and treat JB as margin-dilutive near term. We disagree: the market is extrapolating the amortisation-and-interest step-up (net margin fell to ~9–12% in the Mar/Jun quarters) rather than the underlying ~27–30% EBITDA margin and cash generation. Three mispricings:
- Synergy optionality: street models modest JB cost synergies; cross-selling into Torrent's India CV/GI network historically lifts acquired-brand EBITDA margins 150–200bps within 8–10 quarters (Curatio playbook).
- Deleveraging speed: ~₹2,500+ Cr FCF/yr should cut acquisition debt sharply by FY28E, unwinding the P/E optics as net debt/EBITDA trends below 1x.
- Scale compounding: ~₹20,600 Cr FY27E revenue makes Torrent one of India's largest listed branded-generics platforms — structurally deserving premium-multiple persistence vs mid-tier peers.
Catalysts and risks
- Quarterly beats as JB revenue synergies land; FY27 guidance upgrade at Q2/Q3 results.
- US ANDA approvals / limited-competition launches re-accelerating the base business.
- Brazil & EM brand launches leveraging JB's CEM/SSA distribution footprint.
- Deleveraging milestones; potential credit-rating upgrades post debt paydown.
- Key risk: at ~70x FY27E P/E, the stock has little support if growth slips below ~12%; integration slippage, US price erosion/FDA issues, NLEM/NPPA price controls, and FX volatility (BRL, EUR) are the other watch items.
The bottom line
OVERWEIGHT | PT ₹5,800 (12M) | Conviction: Medium-High. Bull case: JB synergies + deleveraging drive FY28E EPS to ₹90+; a re-rating toward 75x yields ₹6,700+. Bear case: growth < 10% and integration drag compress the multiple to ~55x FY28E (~₹4,700, ~6% downside). Reward-to-risk ~2.7:1. Own it for the compound; add on any amortisation-driven weakness.
Data sources: public information as of 27–28 Aug 2026 — Screener.in (price ₹4,999; market cap ₹1,90,146 Cr; P/E 85.2x; ROE 27.4%; holdings), Google Finance (quarterly income statements Q2 FY26–Q1 FY27), company disclosures, Wikipedia (JB Chemicals acquisition announced May 2025, ~₹11,917 Cr for the control stake plus open offer). FY27E/FY28E figures are illustrative estimates and may differ materially from consensus or actual results. This document is an AI-generated research note prepared for information and illustration only. It is not investment advice, not an offer to transact, and is not affiliated with or endorsed by any broker or bank. Figures are compiled from third-party public sources that may be delayed or revised. Equity investments carry risk of loss; consult a SEBI-registered investment adviser before acting.
| Rating | OVERWEIGHT |
| Price (27 Aug 26) | ₹4,999 |
| 12M price target | ₹5,800 (+16%) |
| Market cap | ₹1,90,146 Cr |
| 52-week range | ₹3,480 – ₹5,250 |
| P/E (TTM) | ~79–85x |
| P/B | ~20x |
| ROE (3Y avg) / ROCE | 26.2% / 15.2% |
| Dividend yield / payout | 0.76% / ~58% |
| Promoter holding | ~68% (FII ~16%, DII ~13%) |